
Updated · Feb 11, 2024
Updated · Jul 31, 2023
With more than five years of experience in the background check industry, Ritesh Kumar founded Looku... | See full bio
Florence is a dedicated wordsmith on a mission to make technology-related topics easy-to-understand.... | See full bio
Data wrangling (also called munging) makes raw data easier to work with. It involves cleaning up data, transforming it into a suitable format, and organizing it for analysis.
This process can be manual or automated to handle today’s growing data.
Data wrangling tools play a crucial role. These tools help automate repetitive tasks such as data cleaning and merging. It saves time and reduces the chances of error.
If you’re looking for data-wrangling tools for your data analysis projects, this article is for you. Read on.
Data wrangling tools make identifying patterns, spotting anomalies, and uncovering meaningful insights hidden within the data easier. They give analysts the ability to handle complex data more efficiently.
Here are eight tools used for data wrangling:

Pricing
Key Features
|
Pros |
Cons |
|
|
Talend is a user-friendly data wrangling tool for data preparation, cleaning, and manipulation. It offers a browser-based platform with a simple interface.
Users can easily apply rules to datasets, share them with teams, and integrate them with various enterprise systems.
This tool supports code-based customization and built-in Extract, Transform, and Load (ETL) capabilities. It’s suitable for beginners and experienced users alike.
Talend uses machine learning algorithms for cleaning and transforming data. It provides automated recommendations and governance features. This tool also allows for easy sharing and integration of data preparations.

Pricing
Key Features
|
Pros |
Cons |
|
|
Alteryx is a powerful data wrangling tool that combines data profiling, analytics, and data science capabilities in one place. It offers over 100 pre-built tools for tasks like find-and-replace and fuzzy matching.
This tool has an intuitive interface, allowing users to connect and clean data from multiple sources. It includes spreadsheets, mobile apps, social media, and others.
Alteryx outperforms MS Excel when working with large datasets and seamlessly integrates with other tools for data visualization. It also supports blending spatial data files with third-party data like demographics for more comprehensive analysis.

Pricing
Key Features
|
Pros |
Cons |
|
|
Altair Monarch helps make complex and unstructured data easier to understand and work with. It is known for extracting various sources, including challenging formats like PDFs and text-based reports.
With Altair Monarch, you can define rules to transform the data and directly insert it into your Structured Query Language (SQL) Database.
This tool provides many functionalities, with over 80 pre-built data preparation functions. These functions cover a variety of tasks needed for data transformation.

Pricing
Key Features
|
Pros |
Cons |
|
|
Datameer is a tool designed to help software engineers with data wrangling and integration. It is a Software-as-a-Service (SaaS) platform that simplifies the instruction, manipulation, and loading of datasets into cloud data warehouses.
This tool allows users to input data in various formats, such as CSV and JSON, and perform aggregation on the datasets. It includes catalog-like data documentation, comprehensive data profiling, and discovery.
Datameer operates on a scalable data warehouse and utilizes efficient data stacks and functionalities similar to those found in Excel to transform data.
These transformations enable users to derive meaningful insights from the data for analysis and decision-making purposes.

Pricing
Key Features
|
Pros |
Cons |
|
|

Pricing
Key Features
|
Pros |
Cons |
|
|
Tableau, a data visualization tool, allows you to create visually appealing and interactive reports.
With Tableau, you can preview your data quickly and easily in a data preview window. This feature allows you to see the critical elements of your dataset at a glance. It makes it easier to understand its structure and content.
Tableau’s data prep functionality is less extensive than other dedicated data wrangling tools.
However, despite its limitations in data wrangling, Tableau shines in creating captivating reports and dashboards. It provides a visually rich and interactive environment that makes data exploration and analysis more engaging and enjoyable.

Pricing
Key Features
|
Pros |
Cons |
|
|
R is a powerful tool for handling and analyzing data in various fields. It is designed specifically for statistical computing and graphics.
This tool consists of a programming language and an environment. The language itself is used to write scripts and commands to manipulate data.
It provides various statistical techniques, clustering, classification, and data analysis functions.
The R environment provides a collection of software packages that extend the functionality of the language. These packages offer additional tools and functions for data visualization, manipulation, import/export, and more.

Pricing
Key Features
|
Pros |
Cons |
|
|
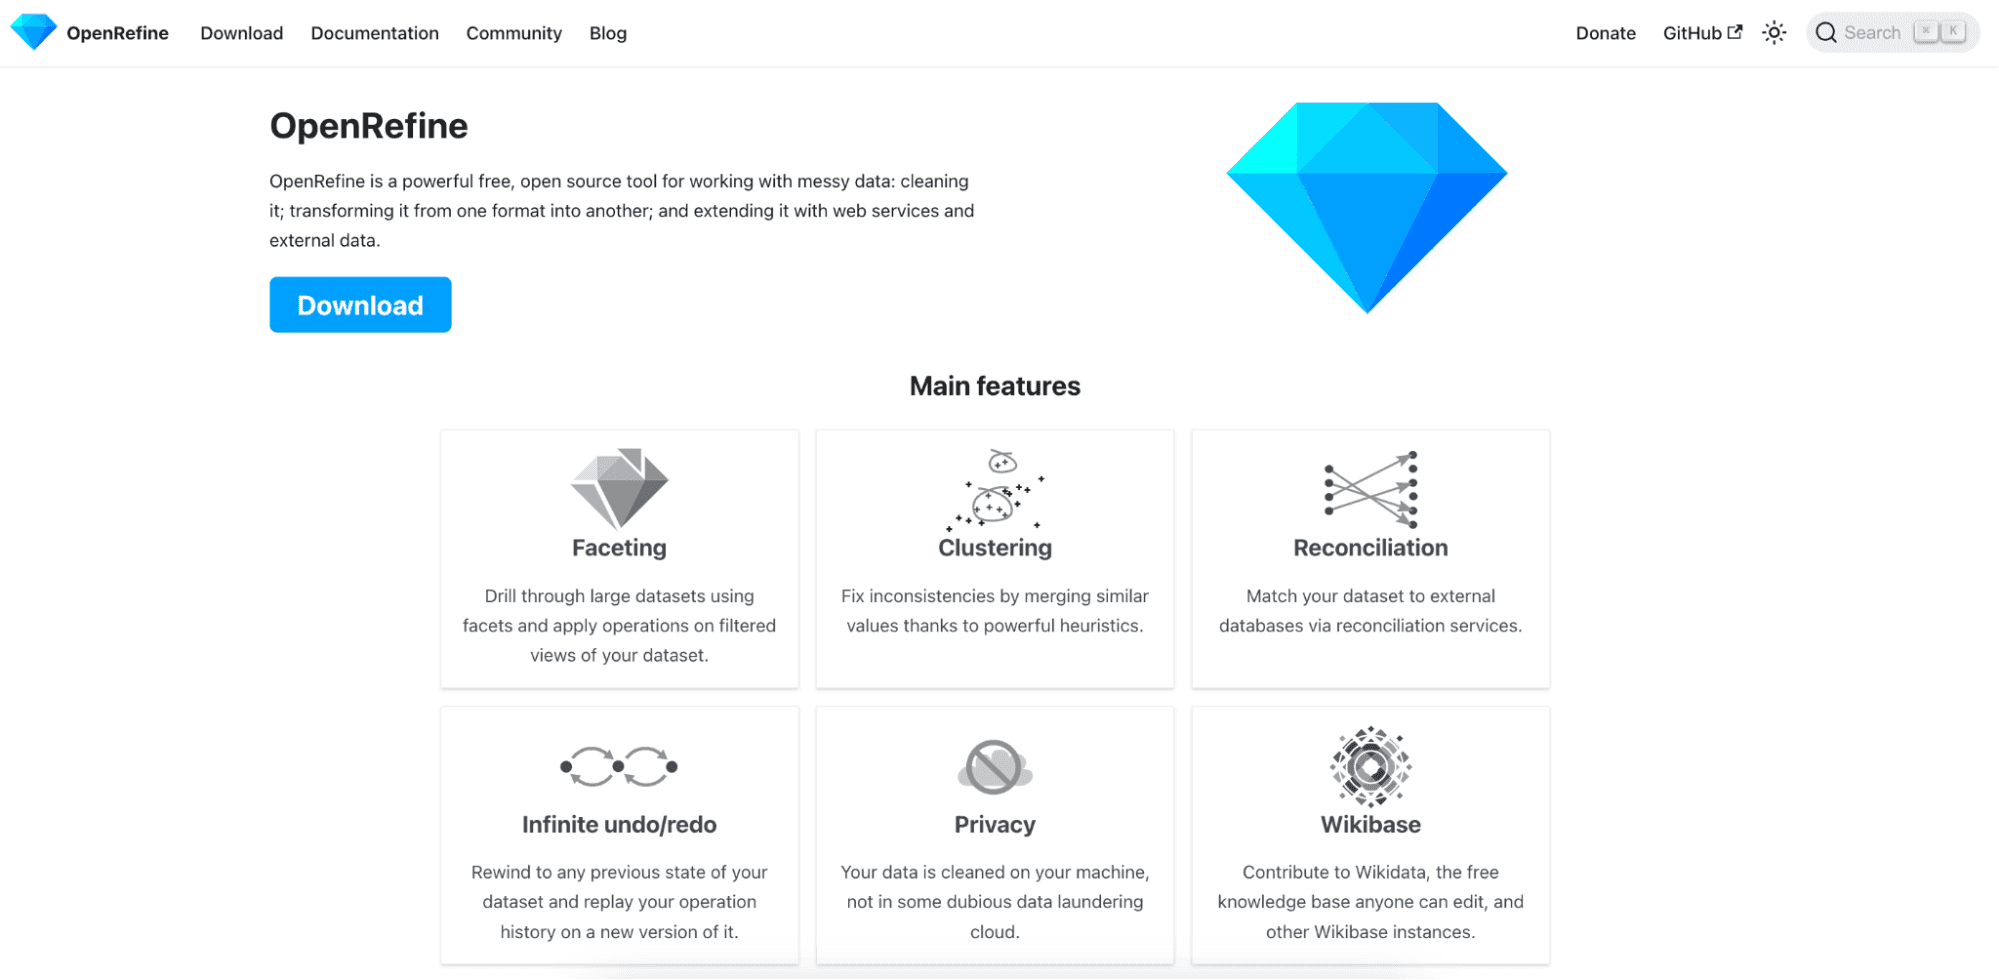
OpenRefine is an open-source tool that helps you clean and organize messy data. It is designed to quickly explore datasets and transform the data into the desired format.
This tool allows you to apply complex transformations to individual cells in your dataset. It uses filters and partitions to sort and filter your data.
OpenRefine works with data wrangling projects, allowing you to work with datasets from web URLs, computer files, and databases. You can easily pull these datasets into your project and work on them locally on your machine.
Data wrangling is essential for several reasons:
Data wrangling ensures raw data is cleaned, transformed, and structured to be effectively used for downstream analysis.
This guarantees that high-quality data is entered into the analytical process. It leads to more accurate and reliable results.
Data wrangling involves gathering and bringing data from varying sources to a centralized location. This allows for easier access and integration of data.
Automated data integration tools used in data wrangling help clean and convert source data into a standardized format.
It can be used consistently across different datasets. This standardization enables businesses to perform crucial cross-data set analytics.
Data wrangling helps identify and remove noise, errors, and missing elements from the data. The resulting clean data provides a more reliable basis for analysis and decision-making.
With proper data wrangling, the integrity and reliability of the analysis can be maintained. This may lead to missed opportunities and flawed models that harm the organization’s reputation.
Data wrangling is about preparing and refining data for analysis. Tools for this process offer features like data visualization, data quality checks, and data integration. These allow efficient handling of complex data while saving time by automating repetitive tasks.
When choosing a data wrangling tool, select what fits your needs, preferences, and budget.
Yes, SQL is commonly used for data wrangling tasks. SQL commands allow you to manipulate and transform data from various sources, like CSV files, web services, and databases.
Data wrangling in Excel involves three standard methods. This includes removing extra spaces with the TRIM function, finding and replacing texts, and distributing cell contents to adjacent columns.
Your email address will not be published.
Updated · Feb 11, 2024
Updated · Feb 11, 2024
Updated · Feb 08, 2024
Updated · Feb 05, 2024


