
Wiki Guide: How to Extract Data from Wikipedia Using an API?
![Muninder Adavelli]()

Muninder Adavelli
Updated · Feb 11, 2024
Updated · Jan 02, 2024
Harsha Kiran is the founder and innovator of Techjury.net. He started it as a personal passion proje... | See full bio
After getting a master's degree in Literature, Publishing, and Mass Media, Teodora spent most of her... | See full bio
This page may contain links to our partners’ products and services, which allows us to keep our website sustainable. Тechjury.net may receive a compensation when you sign up and / or purchase a product or a service using our links. As an Amazon Associate we earn commissions from qualified purchases. This comes at no extra cost to you. On the contrary, these partnerships often allow us to give you discounts and lower prices. However, all opinions expressed on our site are solely ours, and this content is in no way provided or influenced by any of our partners.
Cell phones take up a big chunk of people's daily lives. So much that the average American phone user spends 4 hours and 25 minutes daily on their phones. These include browsing, online shopping, playing games, communicating, and more.
Statistics show that mobile phones and smartphones comprise 52% of the world's internet traffic. As the population of new cellphone users grows, so does the time spent.
Discover how much time Americans spend and use on cellphones today with these facts, data, and statistics below.
In today's world, mobile accounts for more than half of the internet time. This trend is also expected to increase even further.
Learn more about how Americans use their smartphones and mobile devices and how these affect statistics.
(Exploding Topics)
According to stats on how Americans spend time, people check their phones 58 times daily. Nearly 52% of phone checks (30 per day) occur during work hours.
Checking phones has become a habit as data shows that 50% of all screen time sessions begin within 3 minutes of phone use.
(Oberlo)
Mobile phones are flexible, durable, and easy to use. To top it all, they can provide quick information to users, even while on the go. So it’s no surprise that around 52.4% of the global population access the internet via mobile.
|
Fun Fact: Mobile phones and gadgets currently make up 80% of the internet percentage. This includes surfing the web, accessing social media, and online messaging. |
(Reviews.org)
Reports further tell us that the top 10% of heavy phone users have an average of 5,427 daily touches on their mobile phones.
Mobile phone users also spend 3 hours and 2 minutes daily on videos. Most users who spend more than 3 hours on videos are the younger generation.
This includes connecting with friends on social media, checking emails, responding to messages, advertising products and services, researching, and watching movies and other video content.
The rate of smartphone ownership is on the rise and has been so over the last few years, with over 6.92 billion smartphone users as of May 2023.
Currently, 85% of American adults own a smartphone. Roughly everyone across all age groups is a smartphone owner.
Find out how deep smartphone penetration is in the United States as of 2023.
(Statista)
In a 2021 survey, researchers forecasted that smartphone ownership would keep rising steadily in the next few years.
The number of people who utilize gadgets will increase by about 37.43 million between 2018 and 2025, reaching over 311 million.
(Zippia)
The smartphone penetration in the US economy is high. However, it is also important to note that the level of smartphone penetration varies across different age groups.
100% of those between the ages of 18 - 29 in America are owners of mobile phones. In comparison, 96% of those happen to be owners of smartphones.
(Incredi Tools)
Almost all college graduates in America own a smartphone device. Smartphone ownership has a positive relationship with education, as 93% of college graduates own one, compared to just 75% of those with a high school education or less.
(Exploding Topics)

Although many baby boomers say they prefer to access the internet using personal computers, about 4 in 10 still own mobile devices, preferably tablets.
This number is a significant increase when compared to what was reported in similar research conducted in 2013. At that time, only 13% of baby boomers owned a smartphone.
Mobile phones allow people to carry out various activities on the go. People can now shop, sell, send, and receive online transactions with their mobile phones. 75% of consumers shop using mobile phones for convenience and accessibility.
Check out the following stats for more insights into how Americans use their mobile phones:
(Demand Sage)
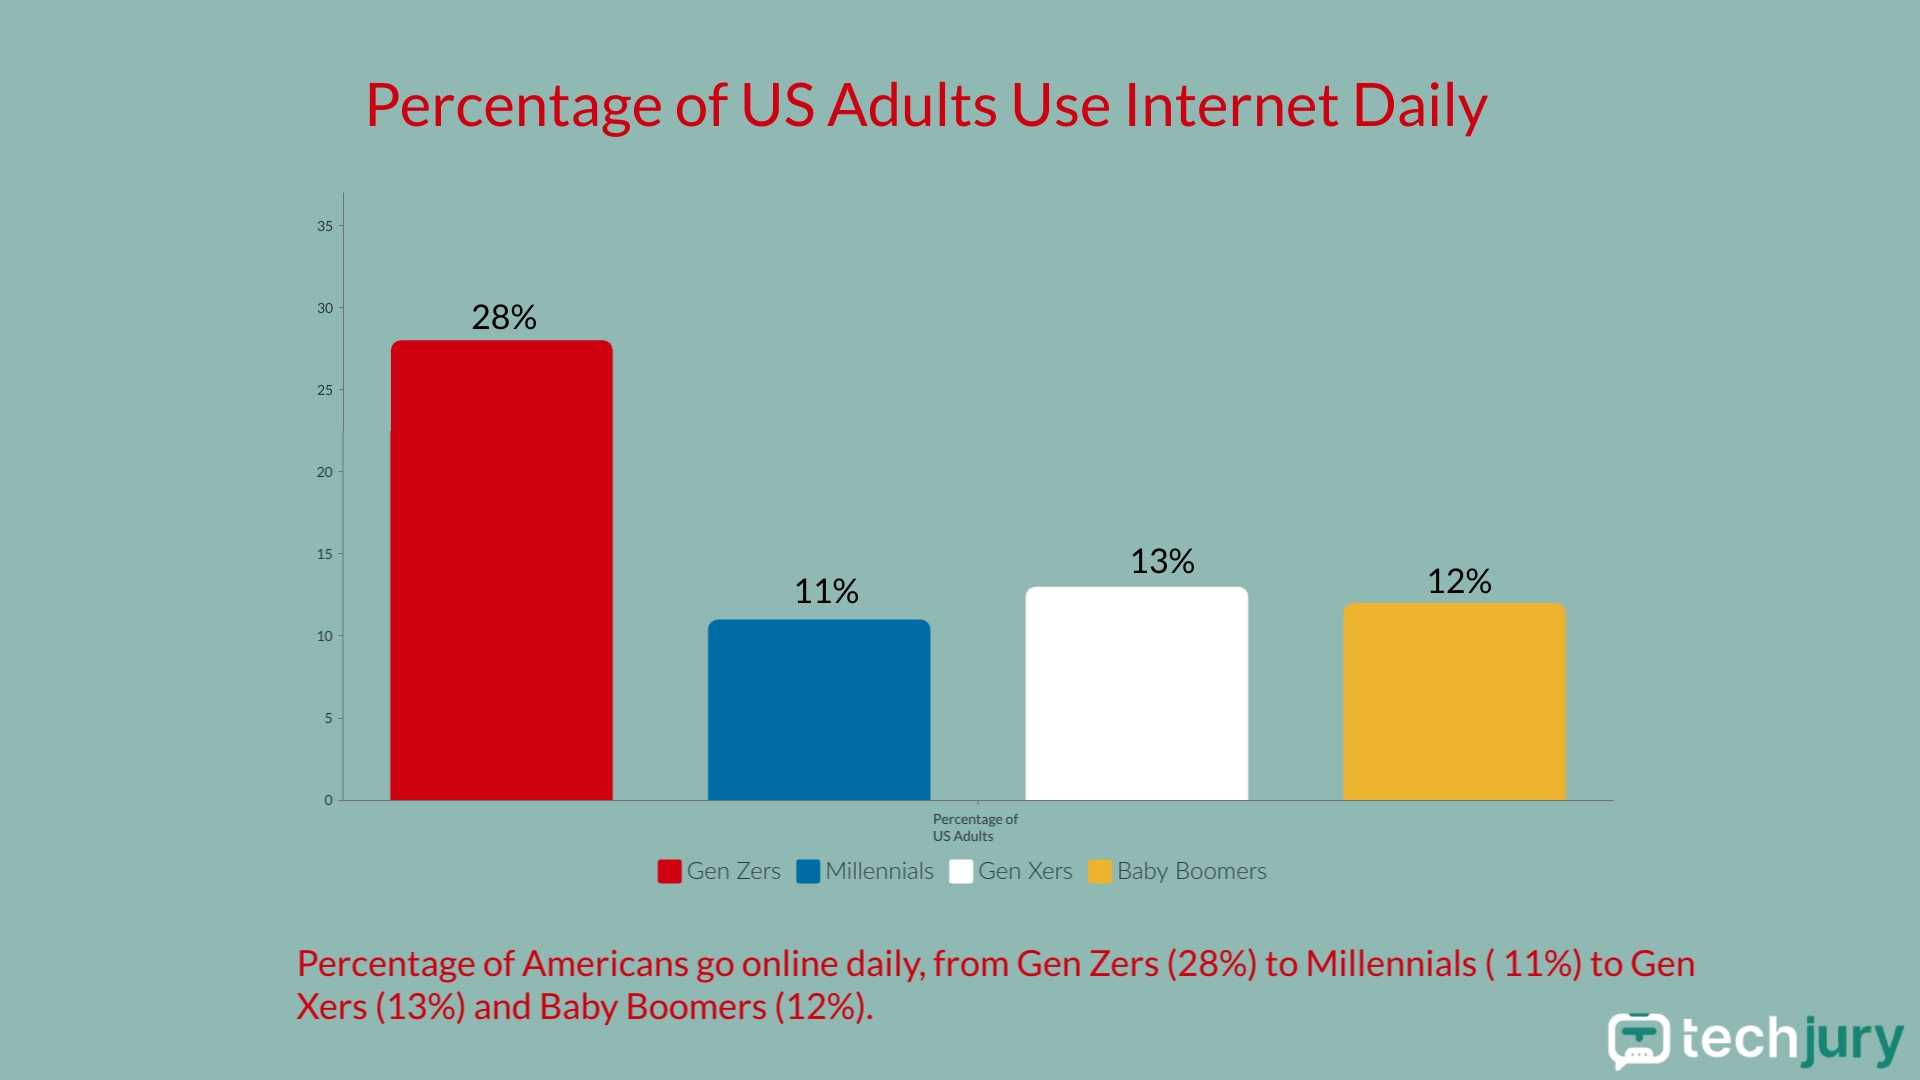
A substantial percentage of Americans go online daily, from Gen Zers (28%) to Millennials ( 11%) to Gen Xers (13%) and Baby Boomers (12%).
Smartphone addiction is common in Gen Zers as they spend nearly 9 hours on social media platforms and all over the web daily. Millennials also spend 3.7 hours on their phones daily.
(Zippia)
An average user's global time on the internet is 4 hours and 25 minutes. The US stands amongst the countries with the highest amount of time spent online. Countries like the Philippines have a significantly higher internet time daily.
(Earth Web)

Millennials and baby boomers constitute the highest percentage of mobile phone users who prefer to text.
According to reports, millennials are also likely to spend 48 minutes each day texting and another 41 minutes chatting on their mobile phones.
(Provision Living)

Mobile emailing is one area where the older generation stands out. This may be because a more significant percentage of baby boomers fall under the working class category.
They have to deal with clients and business partners, and emails are the most preferred form of communication. Additionally, email accounts of all ages are expected to reach 4.6 billion users in 2025.
(Slick Text)
The time equals 205 minutes a day. The significant amount of time is due to most millennials relying on their mobile phones for daily activities.
Some companies and businesses in the US also require their employees to access certain mobile phone features, such as content creation, marketing, and messaging through mobiles.
(Slick Text)
Despite the preconception that the younger the user, the more time they spend on mobiles. However, Baby Boomers trail behind millennials by 1 hour and 9 minutes. Boomers spend a total of 136 minutes.
On the other hand, Gen X spent around 169 minutes, almost 2 hours and 48 minutes.
(True List)
A good number of Gen Zs spend 9 hours of their screen time across multiple screens like; smartphones, tablets, laptops, desktops, and TVs.
This is unsurprising since Gen Zs grew up alongside technology and are more receptive to gadgets and mobile use.
(Review42)
Facebook and Instagram are the two most used social platforms responsible for most Americans' time on social media at 74%.
TikTok has been making waves recently, surpassing Instagram as the most downloaded app. Still, the average American spends 38 minutes on Facebook daily.
|
Fun Fact: TikTok is currently the most downloaded app, with 2.6 billion total downloads. |
Like it or not, screen time is on the rise in America. Mobile phones have become a massive part of that movement.
However, mobile phones aren’t the only cause - people’s technology adoption is making these numbers high, driving a cause for concern.
The following screen time stats for Americans tell more:
(Comparitech)
Mobile devices consume more screen time, especially for teenagers and young adults. This is slightly above average and over 1 hour longer than the British, who average 5 hours and 47 minutes of screen time daily.
But the biggest screen-time consumers are South Africans, who average around 9 hours and 38 minutes daily. However, millennials and baby boomers still spend quality on-screen time watching TV.
(Exploding Topics)
According to screen time stats for Americans, on-screen time is highest for American teenagers. More than 7 hours of those are spent on mobile phones.
Many parents try to limit their teenagers’ screen time but find it challenging due to the rising adoption of technology in schoolwork and education.
The time spent on phone screens is increasing daily, not just in America. Globally, the world is also experiencing a shift towards mobile. Here are some statistics on mobile users worldwide.
People spend more time online than they did 10 or 20 years ago. This has brought about an increase in time spent on the phone screen.
Many factors contributed to the rise of screen time, such as the broader use of mobile phones, internet access, and the latest technology.
Get to know what the world does online with the following statistics.
(Data Reportal)
As of 2023, the global population stands at about 8 billion. Of them, around 64.4% are internet users, roughly 5.18 billion people.
95% of these people use their phones to access the web. Moreover, mobile phones account for half of the world’s web traffic.
(Exploding Topics)
iOS and Android are leading the smartphone usage parade. Currently, Android has the largest share at 71.77%, while iOS lags at 27.6%.
The convenience and ease of access to various social platforms and transactional purposes provided by smartphones with those OS will continue to ensure massive global adoption.
(Statista)
The numbers are forecasted to grow exponentially in the next couple of years. Countries that currently hold the highest amount of smartphone users are China, India, and the US.
Smartphone mobile network subscriptions worldwide reached nearly 6.6 billion in 2022 and will exceed 7.8 billion by 2028.
(Back Linko)
Almost 94% had used smartphones for social network surfing. The smartphone is a portable device used chiefly by all phone users, and as such, 99% of network surfers use it to surf the internet.
(Data Reportal)

Countries like the Philippines have a higher average internet time - 9 hours and 45 minutes daily. Japan and others have reduced daily internet time to 4 hours and 22 minutes.
Internet activities vary - from surfing the web to accessing social media sites. Some of these users also play mobile games to pass the time, contributing to the daily hours of use.
(Statista)
The average social media usage of internet users worldwide increased from 145 minutes in 2021 to 145 minutes daily in 2022.
Currently, the country with the most time spent on social media per day is the Philippines, with online users spending an average of three hours and 53 minutes daily on social media.
Screen time for men and women differ globally. While men spend most of their screen time on business and entertainment, most females spend it on relationship matters, self-help, and entertainment.
Read on to learn about global screen time statistics demographics:
(GSMA)
Social media in South Asia is perceived to be corrupt, making users shun or have a negative perspective towards its use.
Also, women are believed to be more susceptible to corrupt ways than men. For that reason, the use of social media by women in South Asia is being curtailed.
(Business Today)

In comparison, 68% of surveyed households pointed out that women using mobile phones didn’t just ten years ago.
A further 30% of the respondents don’t own any device, while 2% didn’t even share their views on the subject.
The massive adoption of smartphone devices has proved to be a wise move for all parties involved. However, it comes with a side effect.
Experts are beginning to show concern about how much time the average American spends on their phone and the possible health issues that may result.
Over time, sicknesses like obesity, depression, and anxiety have been associated with excessively high screen time.
In the stats that follow, a slight breakdown of smartphone addiction stats follows:
(Statista)
The world is transitioning to digital, with remote jobs, digital marketing, and e-commerce transforming the world. Social media apps evolve, keeping users engaged and engaged.
The latest data reveals that by 2023, the average time allocated for social media will increase to 55 minutes. That’s six minutes more than in 2020.
Moreover, the mobile media usage time is also set to increase, reaching 4 hours and 29 minutes in 2023.
(Review.org)
One of the significant causes of smartphone addiction is the urge to respond to messages coming into their cell phones.
Mobile phone users can easily download fun-filled apps for free. Due to this, parents should also consider a reliable parental control app to lower kids’ and teens’ access to harmful apps and content.
(Gitnux)
Almost 70% of Americans shopping in-store would look at customer reviews on their mobile device instead of asking a store employee.
58% percent of shoppers also look online for similar products to the ones they are considering buying and are more willing to travel due to good reviews.
(Slick Text)
Over half of all mobile phone addicts in the globe (adults and teens combined) have tried to cut back or reduce their usage.
A more significant majority of them have been successful so far. If you are curious about smartphone addiction, these statistics can show you everything you need to know.
If the info about how much time the average American spend on their phone has shocked you, and you feel like you need to limit your screen time, here are some tips:
Turning off notifications for all apps will prevent distractions, especially when trying to do something important, like work or get a good night’s rest.
“Raise to Wake” is a feature that allows your phone to create a little nudge on your screen. Due to the ease of activating this feature, you can sometimes find yourself unlocking your phone even when it is unnecessary.
This feature can save you lots of productive hours, especially at work. You could do well placing your phone in the “Do Not Disturb” mode.
This will ensure that no social media messages enter your phone, limiting your phone usage to just calls and texts for the rest of your working hours.
Smartphones are incredible devices that enable us to get important things done and help us stay connected to the world. But smartphones have a dark side that, if not used correctly, will lead to addiction.
The amount of time spent using smartphone apps in the US has increased by 25% since 2019. The high usage of smartphones will only continue to increase as there is a prediction that the number of global smartphone users will grow by 12% through 2026.
Apple leads the market share of mobile phones in the US at 57.22%, followed by Samsung at 29.12% brand share, while other brands share about 15% of the US smartphone sales revenue.
Apple iPhone is primarily used in the US, followed by Samsung and Google Pixel.
97% of Americans own a cellphone, and 85% own a smartphone.
It's up to the parents to judge whether their child is ready for a cell phone. However, the average age kids get a phone is between 12 and 13.
As of the first quarter of 2023, iPhones led with a 57.75% market share in the US, while Android generated 41.88% shares. IOS has dominated the US operating system market since 2009 up until the present.
Apple phones offer better performance and are built to work faster and smoother than Android. Even the old iPhone models work well and have smooth functioning.
SHARE:
Your email address will not be published.
Updated · Feb 11, 2024
Updated · Feb 11, 2024
Updated · Feb 08, 2024
Updated · Feb 05, 2024