
Wiki Guide: How to Extract Data from Wikipedia Using an API?
![Muninder Adavelli]()

Muninder Adavelli
Updated · Feb 11, 2024
Updated · Jan 02, 2024
Muninder Adavelli is a core team member and Digital Growth Strategist at Techjury. With a strong bac... | See full bio
If I was asked to describe myself using just a few words, I’d go with digital marketing expert, ex... | See full bio
This page may contain links to our partners’ products and services, which allows us to keep our website sustainable. Тechjury.net may receive a compensation when you sign up and / or purchase a product or a service using our links. As an Amazon Associate we earn commissions from qualified purchases. This comes at no extra cost to you. On the contrary, these partnerships often allow us to give you discounts and lower prices. However, all opinions expressed on our site are solely ours, and this content is in no way provided or influenced by any of our partners.
Over the past few years, there has been a significant change in how people watch videos. Today, consumers increasingly value videos more than ever before.
If you're a marketing professional trying to determine whether video marketing holds the secret to achieving your objectives, you must know that over 90% of businesses use video marketing strategies.
The video consumption statistics you’re about to discover will arm you with the information you need. From that, you can proceed with whatever action you decide to take.
|
Editor’s Choice
|
Over 3 billion online users watched or streamed videos at least once a month in 2022. As if that’s not already high enough, that figure is expected to grow in the coming years as more people rely on their smartphones and internet speeds keep improving.
The video consumption statistics below shall convince you if you've ever questioned the size of the video market.
(Wordstream)
This statistic means, in today’s age, over 3 decades’ worth of TV content is uploaded every 30 days.
You might wonder how it came to that. Considering how advanced technology is today, making video material is more straightforward and accessible than it was thirty years ago.
(Oberlo, DataReportal)
In this digital age, everyone creates and consumes various types of media. Among the most consumed media types are videos, with 91.8% of internet users worldwide watching digital videos weekly, from music and video tutorials to influencer videos to gaming.
Studies show that people enjoy watching videos because the human brain digests images about 60,000 times faster than words.

(Data Reportal)
Based on that figure, the 2.52 billion people on YouTube make up 33.33% of all Internet users. That figure is unsurprising since YouTube is the most popular video-sharing site.
Moreover, up to 5 billion videos are being watched on YouTube daily, and YouTubers upload 500 hours of video every minute.
People enjoy watching YouTube because it offers a variety of videos from around the world and is free of charge.
(Daily Mail)
In 2022, Americans spent 3 hours and 2 minutes watching digital video. The same year, they watched 3 hours and 7 minutes of television.
The time spent watching TV will decrease to 2 hours and 55 minutes, while digital video will increase to three hours and 2 minutes in 2023.
People nowadays are cutting their cords or canceling their cable television subscriptions. Most cord-cutters belong to the younger generation as they are more interested in the contents of online videos than those they watch on television shows.
|
Learn more: You might wonder whether TVs are slowly becoming obsolete due to the availability of online streaming services and video-sharing sites. Find out the answer through these insightful Techjury articles: |
People prefer watching videos from various social media platforms, creating perfect opportunities for brands to promote their products and services.
The statistics below will show you the most recent data on video marketing and will give you an insight into how companies use videos to their advantage.
(DASH)
If you’re a marketer using video advertisements and your competitor doesn’t, you’re at a huge advantage in terms of income. 
That’s because video ads have the most affordable cost-per-click compared to social media ads. With that, excluding video advertising as part of marketing would be a significant loss. So, more marketers use video in their marketing plans and strategies.
(Social Media Today)
Video marketing is like a storytelling technique providing an appealing experience that captures a viewer's interest.
Because of that, companies are beginning to understand the value of video content marketing, with 81% of organizations employing it. That latest figure represents a 63% relative increase from the previous year.
(Hubspot)
Video marketing stats for 2022 show that over 87% of marketers report getting a positive investment regarding video advertising. This percentage has increased to 90% as of 2023, showing how much video is a powerful tool for the majority.
Due to the positive results, more marketers employ video advertisements across social media platforms. For instance, statistics also tell us that Facebook has the highest social media ROI, with 21% in 2021.
|
🎉 Fun Fact: Videos effectively educate viewers on how products and services will benefit them, enticing them to buy or try such merchandise. Based on further data, 72% of consumers prefer watching a video to learn more about a product. |
(Oberlo)
This stat tells us that almost all businesses that post video content to their social media pages will acquire at least one new customer.
With that, the equation becomes:
|
Social media + video = the world’s most powerful marketing tools |
There’s a significant connection between social media and video, attributed to the 4.8 billion daily active users on social media. Using such channels in your marketing strategies can increase your company's brand awareness and audience engagement.
Here are more social media video stats you’ll be impressed to know about.
(99 Firms)
According to Meta, there are 3 million advertisers on Facebook. One of the most significant benefits of Facebook marketing is that it enables businesses to target clients based on their preferences and demographic information.
Promoting on Facebook using videos is a must since 500 million individuals on Facebook watch online videos daily.
|
💡 Did You Know? Facebook has nearly 3 billion active users worldwide, and 65 million businesses built a profile on the platform. You can learn more about Facebook and its role in advertising by reading these related Techjury articles: |
(Social Pilot)
90% of Instagram users follow at least one business on the platform. Ideally, these business accounts post at least 3 times a week. When they post a video ad, 87% of Instagram users that see it take further action.
In comparison, 62% of people insist that seeing a brand on Instagram Story increases their interest. Meanwhile, this is what the rest of the people do when they see a brand’s Instagram story:
With that, the only downside is getting ignored. Therefore, brands have nothing to lose. So, it's no surprise companies spend $5 to $10 billion for influencer marketing.
(Hootsuite)
TikTok business statistics show that about 92% of users were inspired to take action after watching a TikTok video, such as:
|
✅ Pro Tip: Since the statistics show that TikTok advertising is effective for any size of enterprise, you might be considering getting in that game as well. Here’s a Techjury article that reveals whether TikTok ads are worth it and what are its pros and cons. |
(Hootsuite)
Pinterest is a website that prioritizes static information. Regardless, statistics show that videos remain influential on the platform. After watching pertinent content, video viewers are 5 times more likely to make a buy.
Currently, videos are emphasized on Pinterest since they are preferred by users, increasing their chances of being seen by more people.
|
Here’s how Pinterest users consider videos on the platform: Comment
|
|
💡 Did You Know? Pinterest is used by 59% of users to research purchases. 1 out of 2 Pinners who see a promoted Pin purchase something. |
Video consumption and revenue are linked in ways marketers have yet to understand fully. But one thing’s for sure, and that is the fact that it’s a billion-dollar industry.
These are the video consumption revenue statistics that marketers need to know.
(Digital Journal)
Forecasters reveal that the video streaming market will register a CAGR of around 12.1% between 2022 and 2028. As a result, it will be worth $932.29 billion by the end of 2028.
Demand for streaming services like Hulu, Netflix, and Disney+ is increasing due to their convenience in providing entertainment.
On the other hand, that affects the viewership on traditional television. According to consumers, traditional TV is too expensive compared to streaming services.
With that, more and more people are interested in buying accounts from streaming platforms and enjoying a great movie treat or binge-watch at home.
|
📝 Note: If you’re eager to find out how streaming services have been beating down traditional TV in terms of viewership, here are more suggested articles for you: |
(Use Sign House)
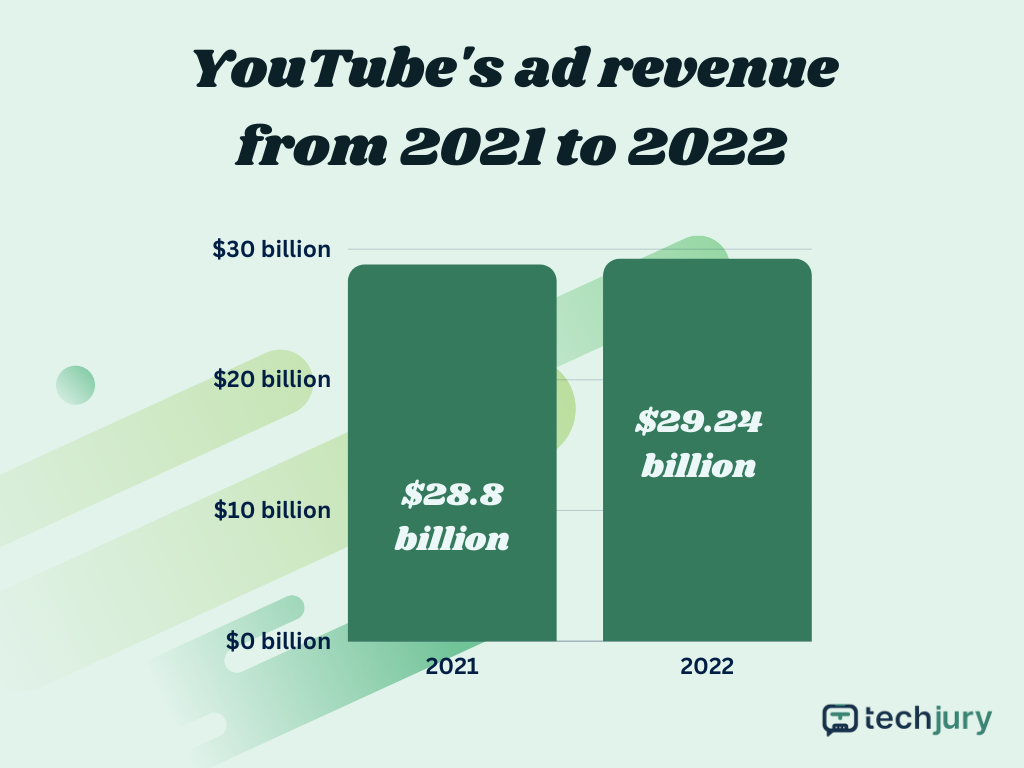
The majority of YouTube's revenue comes from marketing advertisements. New adverts are flowing in as new content providers emerge daily, resulting in a 2% increase in revenue.
(Yahoo Finance)
Because of that, YouTube paid over $50 billion to more than 2 million content creators, translating to about half of what it made over the last 2 years. So that you know, no other video site comes even close.
According to video stats, the number of channels that made more than $10,000 increased by 40%.
The video-sharing platform is a lucrative place for content creators, making it a go-to platform thanks to its revenue-sharing program. It pays them based on the ads they place in their content.
(Global Media Insight)
YouTubers frequently publish shorts due to the increased exposure they can provide. This explains why their popularity has skyrocketed over a short period.
|
💡 Did You Know? Youtube has 2.5 billion users, generating 30 billion views daily. |
How many people prefer to watch videos on mobile? How do mobile video watchers behave? Does smartphone usage have an impact on web video marketing?
You’ve got the questions, and the answers you seek are in the following few mobile video consumption statistics.
(The Social Shepherd)
Watching videos on mobile is undoubtedly becoming the norm since about 90% of all video views come from mobile devices.
(Crisp)
According to 2021 statistics, 92% of people who use their mobile phones for watching videos also share the clips with other users. When they do, they share it across several platforms. This statistic shows us how one viewer can be influential and draw more audience.
Moreover, mobile devices account for 60.66% of website traffic, while PCs and tablets make up 39.34%. Mobile users come out on top when it comes to watching videos online.
(Earth Web)
Based on 2023 data, 42.7% of people use ad-blocking software when watching a video using their mobile phone. That figure can be split and identified based on age group, and it’s led by 35% of people aged 35 to 54 who use ad-blocking software.

Some people use ad-blockers to stop advertisements because they are inundated with irritating, obnoxious commercials, and blocking these ads is their only option.
(Oberlo)
Unlike static and traditional marketing techniques, marketers find video marketing more engaging and raise client awareness of their goods and services. Statistics reflect these positive results.
92% of video marketers admit they've gotten a good ROI from video marketing, getting 66% more qualified leads per year. For instance, video marketing statistics show that about 66% of consumers find short-form videos the most engaging content on social media.
The above discussion of crucial video stats is quite enjoyable, and this list is unfinished. Here are a few more video popularity facts and statistics that may pique your curiosity about video marketing.
(The Social Shepherd)
As mentioned earlier, a human’s brain can comprehend images 60,000 more quickly than text or images. Also, videos can convey essential information in less than a minute. That’s why most people refer to videos as a source of information regarding a product or service.

(Invideo)
Watching videos from different social media platforms has become many individuals' favorite and preferred pastimes for the past years.
That led to the average person watching 100 minutes of videos daily, amounting to 14 hours per week and 420 hours monthly. Compared to 2019, that figure has grown by over 50%.
(Wyzowl)
Video isn’t only becoming more popular. Its existing users are also hungry for more. A whopping 91% of people want brands to produce more videos. Moreover, educational videos are desired by 36% of users.
Although human brains may prefer videos, consumers, on the other hand, consciously prefer them because they are more motivating, amusing, and educational.
(Target Internet)
Jimmy Donaldson, known as MrBeast, is the highest-earning YouTube ever, making $54 million a year after hitting 10 billion views. That amount is twice as much as he accumulated in 2021, showing how significantly his channel has grown in just 1 year.
MrBeast participates in YouTube's partner program; he gets a cut for all advertisements shown in his content. Being the most-watched American YT channel, he was also the most paid.

Jake Paul came in second despite controversies surrounding his name and earned $45 million from YouTube. The third highest earner was Markiplier, with $38 million.
People spend hours watching videos from their favorite social media platforms. The content creators, in turn, have plenty of ways to monetize that attention. In one way or another, video has changed the landscape for businesses and consumers alike.
Think about watching many uploaded videos every day for free! Of course, video consumption is exploding! Now you have the stats to prove it.
Music videos have always been the most viewed content on YouTube. It's the only platform where all new music videos are first released.
As of 2023, users watch an average of 17 hours of online video weekly, a decrease from 19 hours in 2022.
As of January 2023, India had the most significant YouTube audience, with about 467 million users. The United States followed, with about 246 million YouTube viewers. Brazil came in third, with 142 million users.
YouTube monetization is the ability of creators to derive income from their videos. You must have at least 1,000 subscribers and more than 4,000 watch hours on your own channel in the last 12 months to be eligible for YouTube's monetization program.
SHARE:
Your email address will not be published.
Updated · Feb 11, 2024
Updated · Feb 11, 2024
Updated · Feb 08, 2024
Updated · Feb 05, 2024